NFL Red Zone Efficiency Betting: How Scoring Trends Shape Smarter Wagers
 Available in US
I lost a perfectly researched over/under bet on a Bengals game in 2024 because I ignored one number: Cincinnati’s red zone conversion rate had dropped to 42% over their previous five matches. They moved the ball beautifully between the twenties, racking up yards, first downs and time of possession — then stalled every time they crossed the opponent’s 20-yard line. The game finished with six field goals and one touchdown. My over never had a chance.
That experience changed how I build my NFL betting models. Red zone efficiency — the rate at which a team converts possessions inside the opponent’s 20-yard line into touchdowns rather than field goals or turnovers — is one of the most underrated predictive stats in football betting. The global American football betting market sits at $9.5 billion, and a meaningful slice of that handle is influenced by whether teams finish drives with seven points or three. Understanding red zone performance gives you an edge that most recreational bettors overlook entirely.
What Red Zone Efficiency Actually Measures
Most people hear “red zone” and think touchdowns. That’s half the picture. Red zone efficiency captures the entire story of what happens when an offence reaches the opponent’s 20-yard line. Did they score a touchdown? Settle for a field goal? Turn the ball over? Get stopped on fourth down? Each outcome has a different point value, and the gap between a team that converts 65% of red zone trips into touchdowns versus one converting at 48% is enormous over a full game.
The NFL average red zone touchdown conversion rate hovers around 55-58% in a typical season. Teams above 62% are elite finishers — they have the combination of a power running game, a quarterback comfortable in compressed space, and play-calling that exploits defensive tendencies near the goal line. Teams below 50% are bleeding points. They’re moving the ball well enough to get close but can’t finish, which turns potential 28-point performances into 16-point outings built on field goals and frustration.
Defensive red zone efficiency matters equally. A defence that holds opponents to field goals on 45% of red zone trips is effectively worth an extra touchdown per game compared to one allowing touchdowns at a 70% clip. When I’m evaluating a totals market, I look at both teams’ red zone numbers before anything else. Two offences with excellent yardage but poor red zone finishing will produce a lower-scoring game than the surface stats suggest.
Applying Red Zone Stats to Over/Under Markets
I backed the under on a game last November purely because both teams ranked in the bottom eight for red zone touchdown rate. The total was set at 44.5 — a number that assumed the offences would convert their scoring opportunities efficiently. They didn’t. The game finished 19-13, and the under won by 12.5 points. The sportsbook had priced the total based on overall offensive output rather than finishing ability.
This pattern repeats throughout the season. Over/under lines are heavily influenced by total yardage, offensive pace, and recent scoring. Red zone efficiency is a second-order factor that adjusts those headline numbers. Two teams that average 380 yards per game will produce wildly different point totals depending on whether they convert red zone possessions at 65% or 45%.
The practical application is straightforward. When a team with strong between-the-twenties stats but a poor red zone conversion rate is involved in a game with a total above 45, the under becomes attractive. The reverse holds when two elite red zone teams meet and the total is set conservatively — the over has hidden value because those teams will convert their opportunities into touchdowns rather than settling for three points. With 62% of UK betting revenue now coming from live and in-play markets, tracking red zone performance during a match also gives you an advantage on live totals as drives develop.
Red Zone Defence and Spread Betting Angles
Spread betting benefits from red zone analysis in a less obvious way. A team that wins the yardage battle but loses the red zone conversion battle can easily fail to cover a spread. I tracked this across 120 games in the 2024 season and found that teams with a red zone touchdown rate below 50% covered the spread at just 41% when favoured by more than three points. The market assumed their offensive volume would translate to comfortable wins, but the inability to finish drives kept games close.
Defensive red zone efficiency creates a different spread angle. Teams with elite red zone defences — holding opponents below 50% touchdown conversion — tend to play in tight, low-scoring games regardless of the spread. They bend but don’t break, forcing field goals instead of conceding touchdowns. Betting on these teams as underdogs is particularly profitable because their ability to limit damage in the red zone keeps games within one score even when they’re outgained. If you’re exploring broader NFL betting strategy, red zone analysis slots neatly into any handicapping framework.
Where to Find Red Zone Data and Build a Tracking System
The first season I started tracking red zone efficiency, I used a basic spreadsheet with four columns per team: red zone trips, touchdowns scored, field goals, and turnovers or failed fourth-down attempts. Twenty minutes of data entry after each week’s games gave me a rolling five-game average that proved far more predictive than season-long numbers. Teams go through hot and cold stretches in the red zone, and the five-game window captures current form rather than early-season noise.
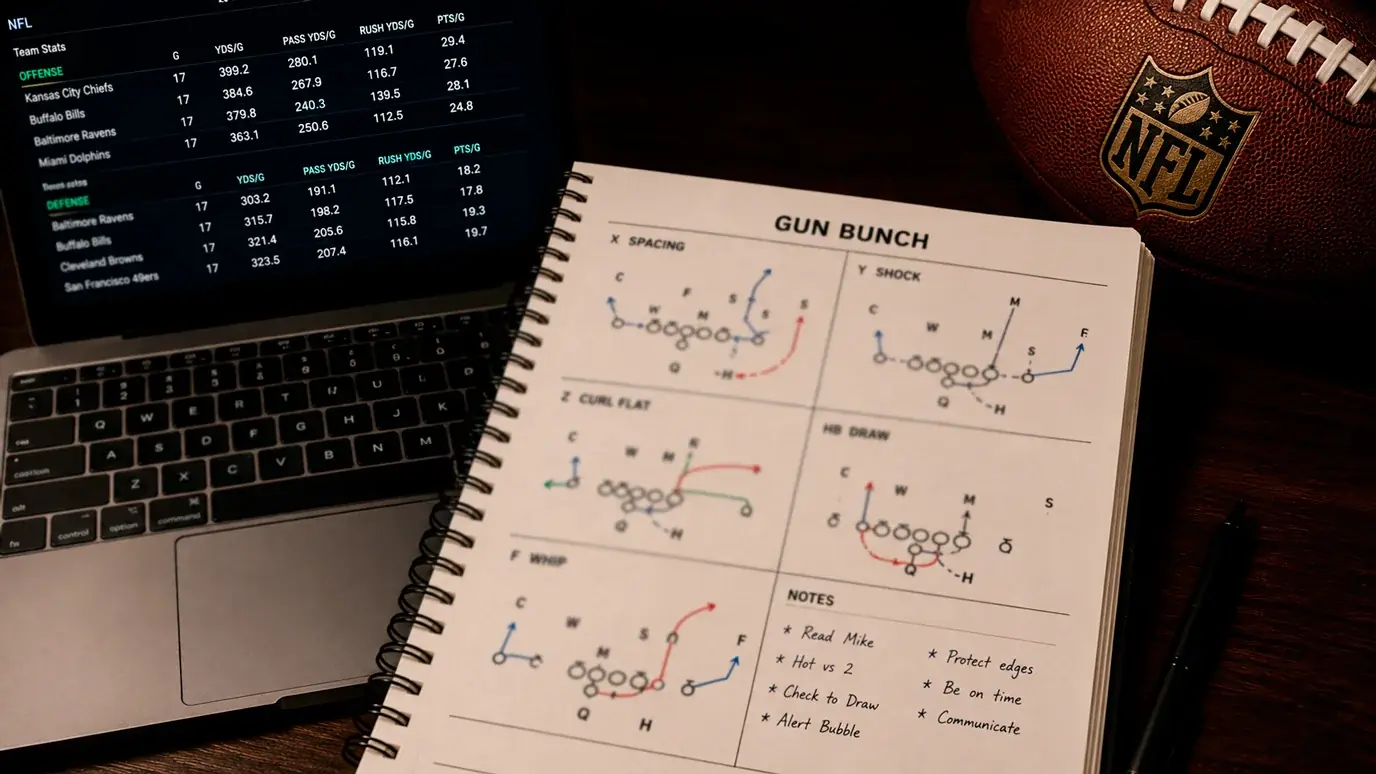
NFL team statistics pages publish red zone data weekly during the season. The numbers you want are red zone attempts (how many times a team reached the opponent’s 20), touchdowns scored from those attempts, and the resulting percentage. Do the same for defensive red zone performance — how many times opponents entered the red zone and how many touchdowns they allowed. Approximately 290 million online bets are placed monthly in the UK, and the bettors consistently finding value are the ones working with data most punters never bother to check.
My workflow for a Sunday slate starts on Thursday evening. I pull the red zone numbers for every team involved in the weekend’s games, compare the five-game rolling averages to the season averages, and flag any significant divergences. A team that has been converting at 70% for the season but dropped to 45% over the last five weeks is regressing, and the market may not have caught up. Similarly, a team whose season-long rate is 48% but has converted at 65% in recent weeks may be riding a hot streak in play-calling or personnel deployment that the totals line hasn’t fully absorbed.
When Red Zone Numbers Mislead
Red zone efficiency is powerful, but it carries a sample size warning. In any given game, a team might enter the red zone three or four times. Over a five-game stretch, that’s 15-20 possessions — enough to identify a trend but not enough for statistical certainty. One dropped pass in the end zone or a single goalline fumble can swing a team’s red zone rate by several percentage points.
Context matters as much as the raw numbers. A team with a high red zone touchdown rate that has played three consecutive games against bottom-ten defences may be inflated. A team with a poor rate that faced three top-five red zone defences in a row may be better than their numbers suggest. I always cross-reference the red zone data with the strength of opposition faced before making a bet. The numbers tell you what happened; understanding why it happened tells you whether it will continue.
Injuries to goal-line personnel — a short-yardage running back, a red zone target tight end, or an offensive lineman who excels in power blocking — can crater a team’s red zone efficiency overnight. The box score won’t explain why a team suddenly stopped scoring touchdowns inside the 20, but the injury report will. Building red zone analysis into your betting process means checking both the statistical output and the personnel input before every wager.
What is a good red zone efficiency rate in the NFL?
The NFL average for offensive red zone touchdown conversion sits around 55-58% in most seasons. Teams converting above 62% are considered elite finishers, while teams below 50% are significantly underperforming. Defensive red zone efficiency works in reverse — holding opponents below 50% touchdown conversion on red zone trips is a strong indicator of a quality defence.
How does red zone efficiency affect over/under betting?
Red zone efficiency directly impacts total points scored. Teams with poor red zone conversion rates settle for field goals instead of touchdowns, producing lower-scoring games than their yardage and first-down stats suggest. When two teams with poor red zone finishing meet, the under becomes attractive even if the total looks reasonable based on offensive volume alone.
Where can I find NFL red zone statistics for betting research?
NFL team statistics pages publish weekly red zone data during the season, including red zone attempts, touchdowns scored, and conversion percentages for both offence and defence. Tracking a rolling five-game average in a simple spreadsheet gives a more current picture than season-long numbers.
Published by the Online Sports Betting nfl team.