NFL Stats for Betting: Which Numbers Actually Predict Winners
 Available in US
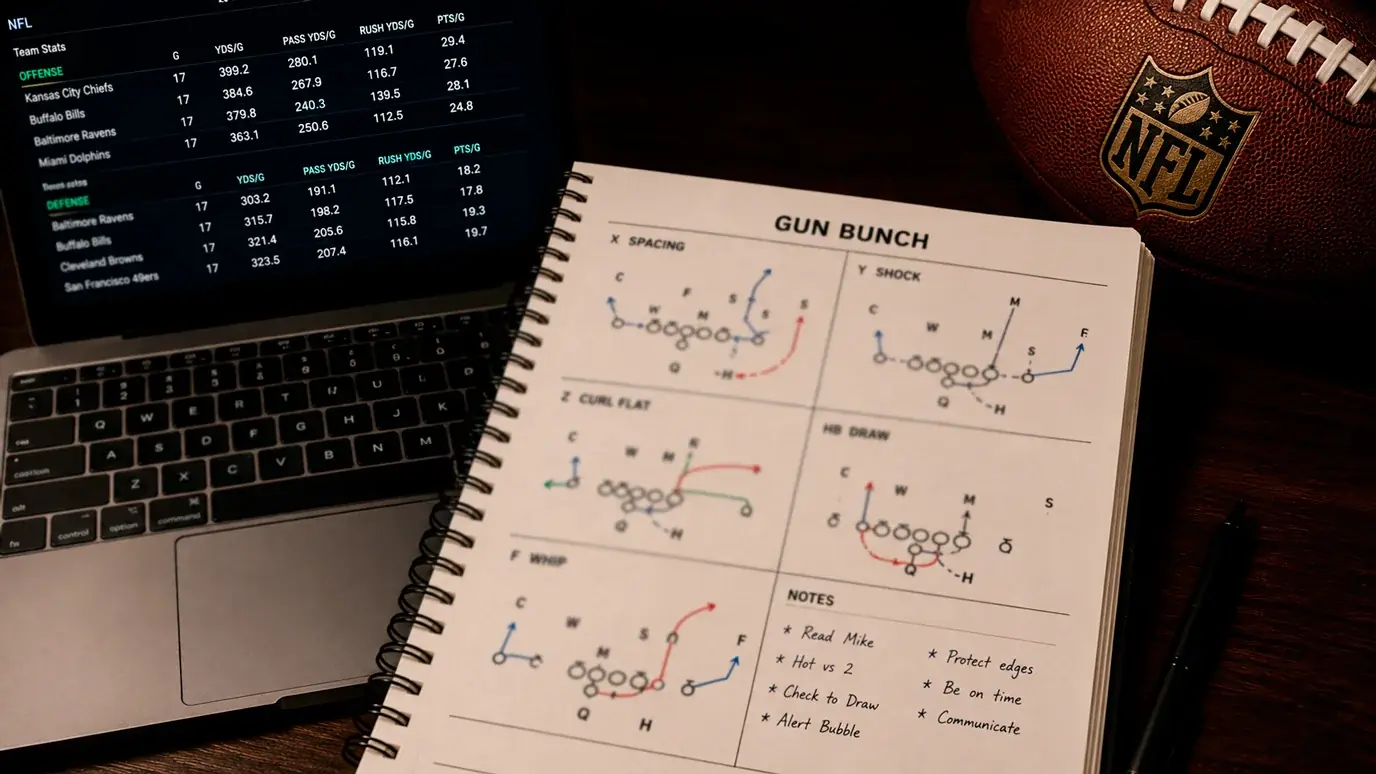
I spent my first two seasons betting NFL games using the same stats everyone else used: total yards, points scored, win-loss records. My results were mediocre — roughly break-even after the vig. Then I started digging into second-level metrics, the numbers that casual bettors never look at, and my hit rate on spreads climbed above 55%. The difference wasn’t talent or intuition. It was knowing which statistics actually correlate with future performance and which ones are just noise dressed up as information.
The NFL generates more publicly available data per game than any other major sport. Play-by-play logs, snap counts, route charts, pressure rates, expected points models — the raw material is there for anyone willing to learn what it means. The 14.3 million NFL followers in the UK have access to the same data as bettors in Las Vegas. What separates profitable bettors from recreational ones isn’t access to numbers. It’s knowing which numbers to ignore.
Efficiency Metrics That Move the Needle
Yards per play tells you more about a team’s offensive quality than total yardage. A team that gains 400 yards on 80 plays (5.0 yards per play) is less efficient than one that gains 320 yards on 55 plays (5.8 yards per play). The second team is moving the ball further on every snap, converting first downs at a higher rate, and sustaining drives with less opportunity cost. Total yardage flatters teams that play from behind and throw 50 times, padding stats while losing.
DVOA — Defence-adjusted Value Over Average — is the single most useful team-level metric for NFL betting. It measures efficiency on every play, adjusts for the strength of the opponent, and separates offensive performance from defensive performance. A team ranked third in total offence but fifteenth in offensive DVOA is benefiting from a weak schedule or garbage-time production. DVOA strips that away and shows you the underlying quality. I check DVOA rankings every Tuesday morning during the season, and when a team’s DVOA ranking diverges significantly from their win-loss record, the spread is often mispriced in their favour.
Success rate is another metric I rely on heavily. A play is “successful” if it gains 50% of the needed yards on first down, 70% on second down, or 100% on third and fourth downs. A team with a 48% success rate is sustaining drives and converting consistently, while one at 40% is relying on explosive plays to compensate for stalled possessions. Explosive-play-dependent offences are high-variance — they look brilliant one week and dreadful the next. Success rate identifies the steady, reliable offences that cover spreads consistently rather than sporadically.
Defensive Numbers That the Spread Ignores
A mate of mine once asked me why I was backing a team that had allowed 30 points the previous week. My answer: I don’t care about points allowed in a single game. I care about pressure rate, third-down defence, and expected points added per play on the defensive side. Those numbers told a completely different story from the scoreboard.
Pressure rate — the percentage of opposing pass plays where the defence generates pressure on the quarterback, whether or not a sack results — is the most predictive defensive stat in the NFL. Sacks get the headlines, but pressure without sacks is equally disruptive and far more sustainable. A defence pressuring the quarterback on 30% or more of dropbacks will force bad throws, hurried decisions, and turnovers over the course of a season, even if their sack numbers look modest. The spread frequently undervalues teams with high-pressure, low-sack defences because the public fixates on sack totals.
Third-down defence deserves its own section in any handicapping model. A defence that holds opponents below 35% on third-down conversions is forcing punts, creating short fields for their offence, and controlling time of possession. The NFL average hovers around 39-41%, so a team five points below that average is generating an extra two or three possessions per game for their offence compared to an average defence. That translates directly into points and covers.
Splits, Situations, and Context
During Week 12 last season, I noticed a team was listed as a three-point favourite in a dome game. Their overall record was 7-4, but their record in dome games that season was 1-2, and their quarterback’s passer rating dropped from 102 outdoors to 84 indoors. The spread didn’t account for that split, and the opponent — a dome team with a 4-0 home record — won by 10. Situational splits are the dark matter of NFL handicapping: invisible in headline stats, powerful when you isolate them.
Home-away splits in the NFL are well-documented but poorly applied. The average home-field advantage in the NFL has been shrinking for years — it’s now worth roughly 1.5 to 2.5 points rather than the historical 3 points that older models assume. Sportsbooks have adjusted, but not uniformly. When I see a home favourite getting 3 points of spread credit for home field in a game where the visiting team has a better road record than home record, I know the line is inflated.
Divisional games are another context where raw stats mislead. Teams in the same division play each other twice per season, and familiarity breeds tighter, lower-scoring games. A team averaging 28 points per game across 17 weeks might average only 22 in divisional matchups. Totals markets frequently overshoot in divisional games because they anchor to season-long averages instead of adjusting for the specific matchup context. The global American football betting market — valued at $9.5 billion — generates enormous liquidity on divisional games, but that volume doesn’t always translate to accurate pricing.
Building a Stat-Based Approach Without a Maths Degree
You don’t need to build a regression model or write code to use stats profitably for NFL betting. What you need is a consistent process: a handful of metrics you trust, a method for comparing them to the market line, and the discipline to bet only when the gap between your assessment and the market’s is large enough to overcome the bookmaker’s margin.
My weekly process takes about three hours. I pull DVOA rankings, success rates, and pressure rates from publicly available sources every Tuesday. I compare each team’s current metrics to their season average to identify trending performance — a team whose defensive pressure rate has jumped from 22% to 31% over the last four weeks is improving in a way the season-long numbers don’t fully capture. Then I look at the week’s spreads and identify games where the metrics suggest the line is off by three or more points. Those are my bets.
Three hours of preparation for a full NFL Sunday slate is modest. The 290 million monthly online bets placed across the UK market include millions of NFL wagers placed with less preparation than a trip to the corner shop. That’s the competition you’re up against, and it’s the reason a disciplined statistical approach to NFL betting consistently outperforms the average bettor. You don’t need to be smarter than the sharpest minds in Las Vegas. You need to be more rigorous than the recreational majority, and a handful of well-chosen statistics gets you there.
What is DVOA and why does it matter for NFL betting?
DVOA stands for Defence-adjusted Value Over Average. It measures a team’s efficiency on every play, adjusts for opponent strength, and separates offensive from defensive performance. It matters for betting because it strips away misleading factors like garbage-time stats, weak schedules, and score-influenced play-calling that inflate traditional metrics like total yards and points scored.
Which NFL stats are most predictive of covering the spread?
Efficiency metrics like yards per play, success rate, and DVOA are more predictive than volume stats like total yards or total points. On defence, pressure rate and third-down conversion rate are strong indicators. These metrics measure sustainable, repeatable performance rather than outcomes influenced by variance, turnovers, or game script.
Created by the ”Online Sports Betting nfl” editorial team.